Calendar Heatmap
basic-report gives you the ability to include calendar heatmaps in your report. The heatmap is a wrapper around the
cal-heatmap javascript library. Most of the options listed on the
docs are actually available through the wrapper.
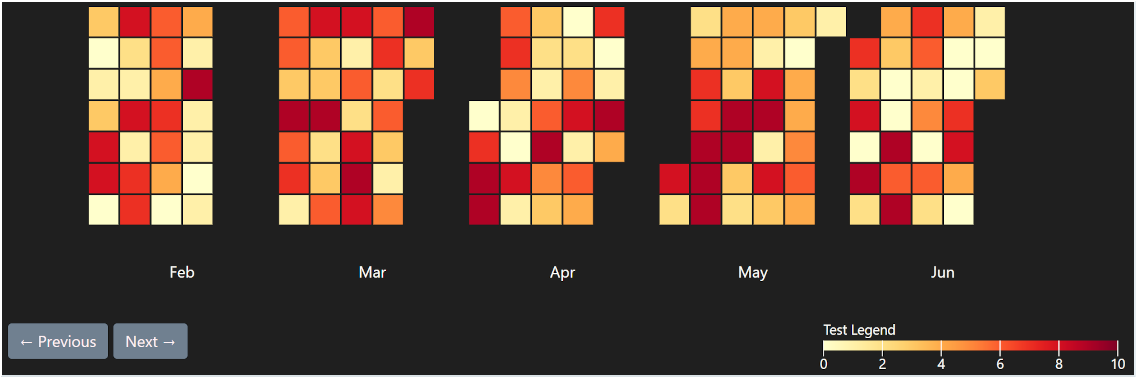
What a calendar heatmap looks like
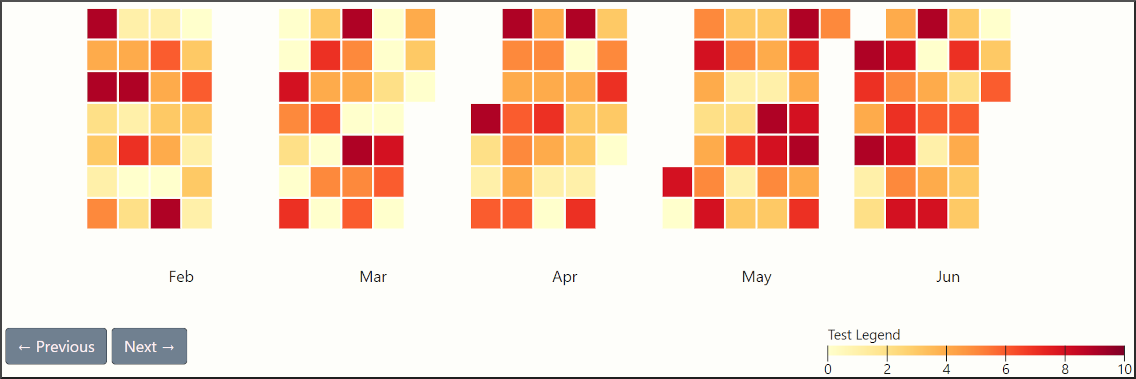
How to create a calendar heatmap
The most basic way to create a calendar heatmap is shown below. It uses the default config of the package, which willl probably not fit your taste.
x = ['2026-03-01']
y = [1]
r.add_calendar_heatmap(x=x, y=y)
To configure your heatmap simply pass a custom config file. All available parameters will overwrite the defaults
x = ['2026-03-01']
y = [1]
custom_config = {
  'date': {
    'start': '2026-03-01',
  },
}
r.add_calendar_heatmap(x=x, y=y, custom_config=custom_config)
Available configuration parameters
misc:
  range: 5
  animation_duration: 200
  vertical_orientation: False
  tooltip_enabled: True
  tooltip_function: 'predefined:date+value'
  tooltip_precision: 2
  legend_width: 300
  legend_label: 'Test Legend'
  legend_font_size: 14
  legend_font_weight: 450

domain:
  type: 'month' # hour, day, week, month, year
  gutter: 4
  padding: [0,0,0,0]
  dynamic_dimensions: False
  sort: 'asc'

label:
  text: 'MMM' # YY, YYYY, M, MM, MMM, MMMM, D, DD, d, dd, ddd, dddd, H, HH, h, hh, null
  position: 'bottom' # top, right, bottom, left
  align: 'middle' # start, middle, end
  offset: [0, 0]
  rotate: null
  width: 100
  height: 100
  font_size: 16
  font_weight: 450

subdomain:
  type: 'day' # minute, hour, day, week, month, xDay, ghDay
  gutter: 2
  width: 30
  height: 30
  radius: 0
  sort: 'asc' # asc, desc
  label: 'D' #M, MM, MMM, MMMM, D, DD, d, dd, ddd, dddd, H, HH, h, hh, m, mm, null
  font_size: 14
  font_weight: 450
  background_color: '#ededed'

date:
  start: '2026-03-01'
  min: null
  max: null
  highlight: ['today']
  weekstart: 1
  timezone: 'Europe/Berlin'

color:
  domain: [0, 10]   # Plot range, for linear interpolation use min max. For thresholds use more
  scheme: 'YlOrRd'  # https://d3js.org/d3-scale-chromatic, set to null if range is used
  range: null       # Hex codes to use as colormap, set to null if scheme is used
  interpolate: null # rgb, hsl, lab, hcl, null
  type: 'linear'    # https://cal-heatmap.com/docs/options/scale#type