Quickstart
Installation
Install the package from PyPI:
pip install basic-report
A Minimal Working Example Report
The following example demonstrates the minimal setup required to generate a report including a report header:
from basic_report import Report

# Create a new report
r = Report('output', 'Minimal Working Example', color_mode='light')
r.add_report_header()
r.add_text('This is a minimal working example')

# Generate the static site
r.dump()
Executing this script creates the following directory structure:
output/
├── css_and_scripts/
└── index.html
Open index.html in a web browser to view the report. No build step, compilation process, or server runtime is required.
The output is a fully self-contained static site ready for distribution.
Next steps: Follow the tutorial below to explore layouting and additional content, have a look at the Full Example Report, or directly head over to Report Elements for a complete overview of all available components.
Building A Proper Report
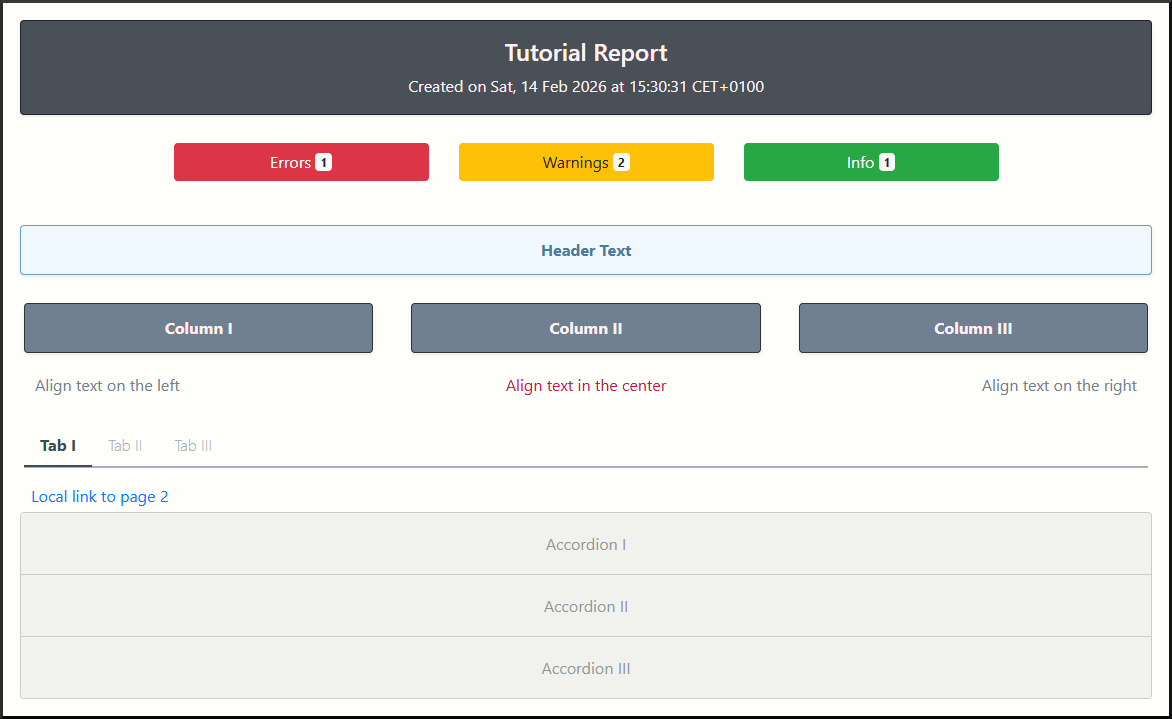
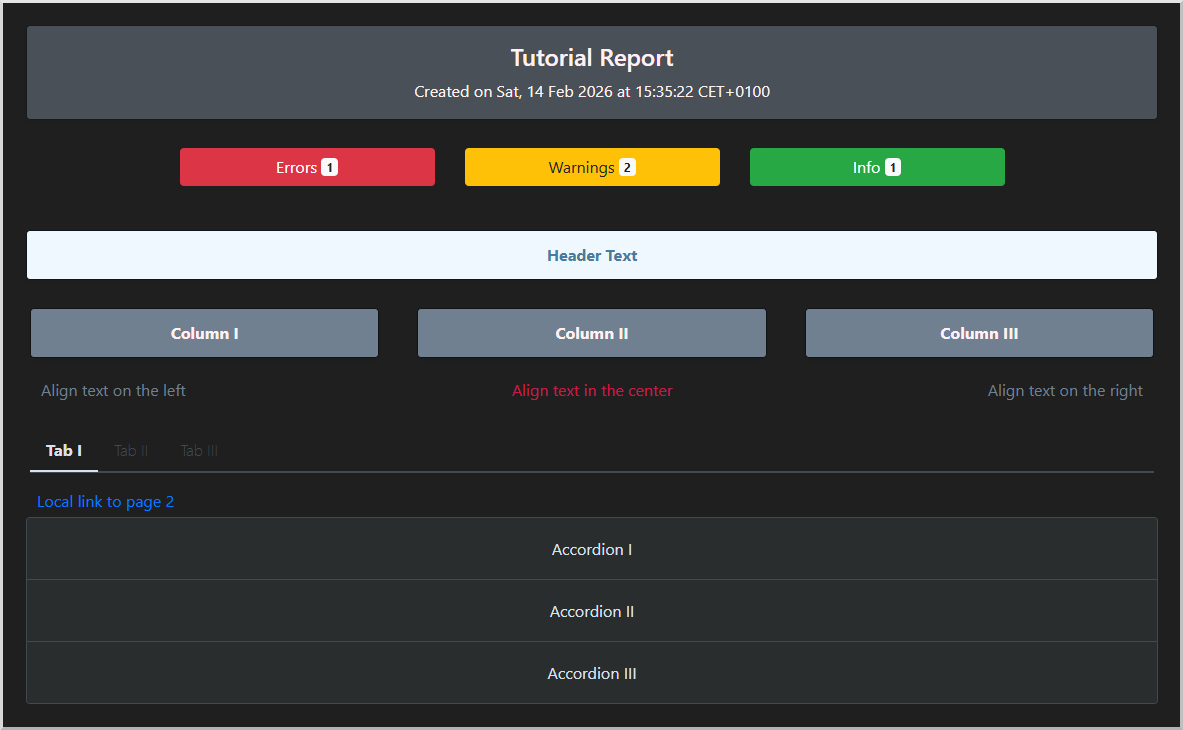
This example demonstrates a ever so slightly more realistic use case, showcasing how you actually stack components to build your report.
Initialize Your Report
import datetime
from pathlib import Path
from basic_report import Report

report_dir  = Path('example_report')
report_name = 'System Status Report'
report_date = datetime.date.today()

r = Report(
    report_dir,
    report_name,
    report_date,
    color_mode='light',
)
import datetime
from pathlib import Path
from basic_report import Report

report_dir  = Path('example_report')
report_name = 'System Status Report'
report_date = datetime.date.today()

r = Report(
    report_dir,
    report_name,
    report_date,
    color_mode='dark',
)
Add a Professional Header
Create a dominant header for your report. By default this header not only shows the name of the report, but also the date given during initialization. Additionally it also shows a sub-text which tells you when exactly the report files were created. However, you can easily deactivate the date options as follows:
r.add_report_header(
    include_date=False,
    include_created_at=False,
    color='steel',
)
Display Structured Status Information
Quickly surface critical information with color-coded status sections:
errors = [
    'Database connection timeout on rnd-server-03'
]
warnings = [
    'Memory usage reached 75%',
    'SSL certificate expires in 14 days',
]
info = [
    'All backups completed successfully'
]

r.add_error_warning_info_section(errors=errors, warnings=warnings, info=info)
Create Multi-Column Layouts
Construct responsive, structured layouts using containers such as columns:
r.add_header('Performance Metrics', color='muffin')

r.open_columns()
r.add_column()
r.add_text('Align text on the left', align='left')
r.add_column()
r.add_text('Align text in the center', color='cherry')
r.add_column()
r.add_text('Align text on the right', align='right')
r.close_columns()
Layout pattern: Open a container element (e.g., columns, tabs, accordions), add content sequentially, then explicitly close the container. The library validates structural consistency and raises descriptive errors if elements remain unclosed.
Create Multi-Page Reports
For larger reports, create and manage multiple pages:
# Create and populate a second page
r.add_page('page2')
r['page2'].add_header('Detailed Metrics')

# Or set it as active and add content directly
r.set_current_page('page2')
r.add_text('Deep dive into performance trends...')
Generate Your Report
r.dump()
The result is a multi-page, self-contained static site with structured layout, responsive design, and integrated navigation. Everything generated entirely from Python code.